Web-based data visualization tools are one of our core areas of expertise. We develop interfaces and reporting tools that make large quantities of data easy for users to access, search, edit, and analyze.
By utilizing powerful client-side technologies such as JQuery UI and DataTables, even the most data-heavy Web applications are lightning-fast and simple to navigate. Our innovative interfaces for accessing and manipulating data are both appealing and foolproof. Quickly filter and sort tables of data, show/hide columns, and watch search results instantly appear as you type.
Charts, graphs, and reports are generated on-the-fly whenever you need them via Google Charts— or, export the raw data to Excel for further manipulation outside the Web-based system.
Your data stays in an online, centralized location (commonly called a "cloud") where any authorized user can access it from any computer in the world. Updates occur in real-time for everyone in the system, so there's never any overlapping revisions to worry about. Daily data backups are included with all our hosting services.
For location-based data, we partner with Google to produce custom, interactive maps. These maps feature the best of Google's technology including satellite and hybrid map views, real-time traffic, driving directions, Yellow Page data, scrolling, zooming, and more. On top of Google's built-in features, we then add custom overlays, routes, and point of interest markers all generated by your data and fully integrated with the other features of your website.
Contact us for ideas on how we can build or transform a database into an elegant, interactive Web-based application.
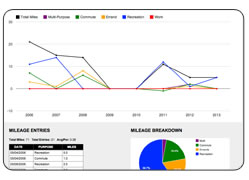
Get real-time reporting through appealing, easy to read charts and graphs.
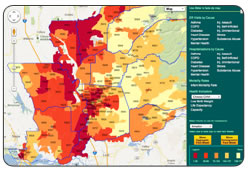
Interact with custom maps generated from your location-based data. Add overlays, routes, markers, and more to the already powerful mapping tools and real-world data available through Google Maps.
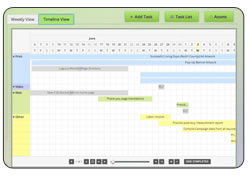
Manage project tasks or other event-based data via an interactive Gantt-style timeline. Quickly jump between time scales, reschedule tasks, or hide and show different categories of events.
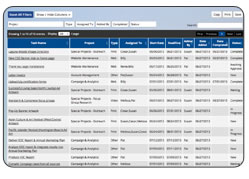
Never lose full access to your data. Easily search, sort, filter, manipulate, print, or export to Excel spreadsheet.